The Most Important Contributor To Pitching Velocity
In the spring of 2019, we got a call from Kyle Barker, CEO and founder of Aeronautic an aeronautical engineering company in Little Rock, Arkansas. Kyle’s son, Will had trained with us for several years, and Kyle was one of the closest friends of Minnesota Twins pitching coach Wes Johnson. When Wes was the pitching coach at The University of Arkansas, Wes had a state-of-the-art pitching lab installed. The lab included a mound with force plates embedded. According to Kyle and Wes, the information gained was incredibly useful, but there was one problem. The sensors in the mound tended to slip and required manual (and somewhat subjective) “scrubbing” of the data after each session. This required up to thirteen hours of work per week and meant that the information could not be shared with the athlete in real-time. Wes asked Kyle if he and his engineers could solve the problem. Kyle accepted the challenge, went “all in” and diverted his team of brilliant scientists from the task of building airplane and space ships to designing a mound with force plate sensors that didn’t slip.
After several months and many challenges, Kyle and his team solved the problem and produced the first-ever Newtforce force plate sensored mound linked to real-time 200 fps video.
That brings us to the call from Kyle. He asked if we would consider beta testing the mound and creating training protocols to make sense of the data. After about a nanosecond of consideration, I said yes. Kyle personally delivered the mound in mid-July and our team got to work. Initially, we kind of just wandered around in it ,trying to find some form, shape or meaning in the information. After a month or so, our Director of Player Development, Wes McGuire, and our Director of Analytics, Jordan Rassman began assimilating the data. They recorded the data from the force sensors combined with Track Man readings and began to study them. First, they looked for linear relationships between pitchers’ velocities and any of the 22 ground force metrics we had agreed to investigate. Obviously, they found none. Then we ran the data through an XG Boost Machine Learning Algorithm that had allowed us to rank the attractors in our dynamic systems theory model of pitching.
After studying the data from over 500 students, the following are the results fo what we found.
NewtForce Analytics
The next phase of our research was to collect, categorize, and analyze the NewtForce data to see if any further significant relationships could be found. We examined twenty-two different items for their importance in predicting velocity. The following diagram depicts a hypothetical force plate reading illustrating data points we looked at and the variables we investigated.
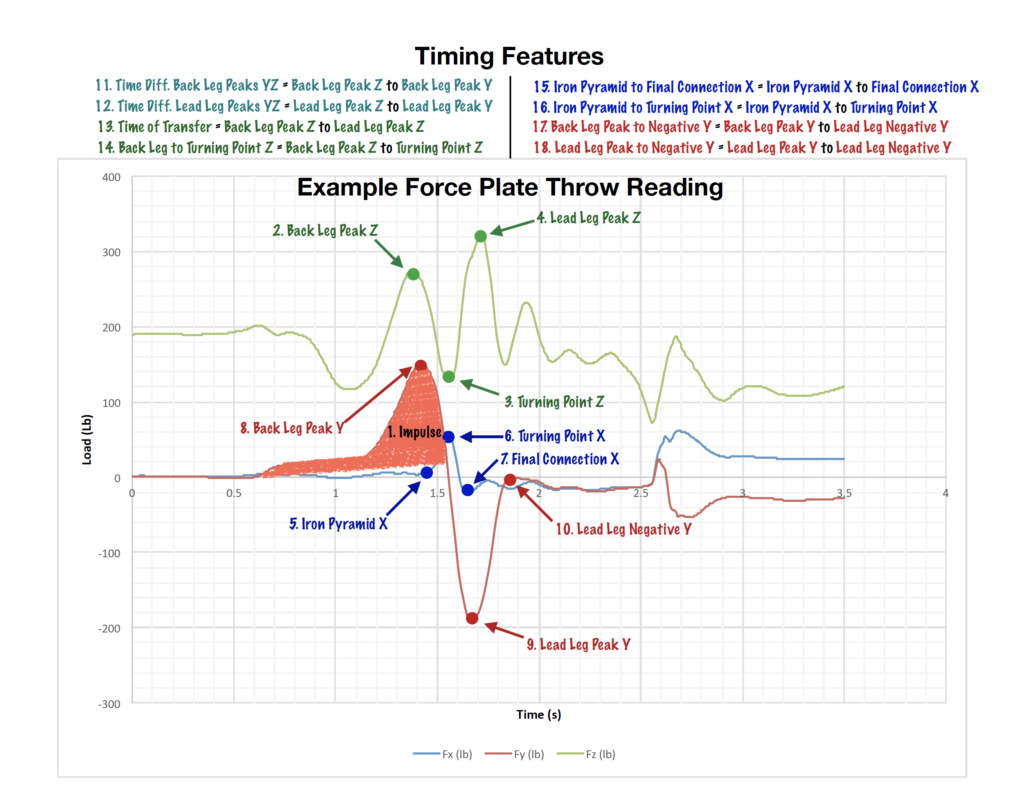
First, we’ll provide a little orientation to the landscape in the graph.
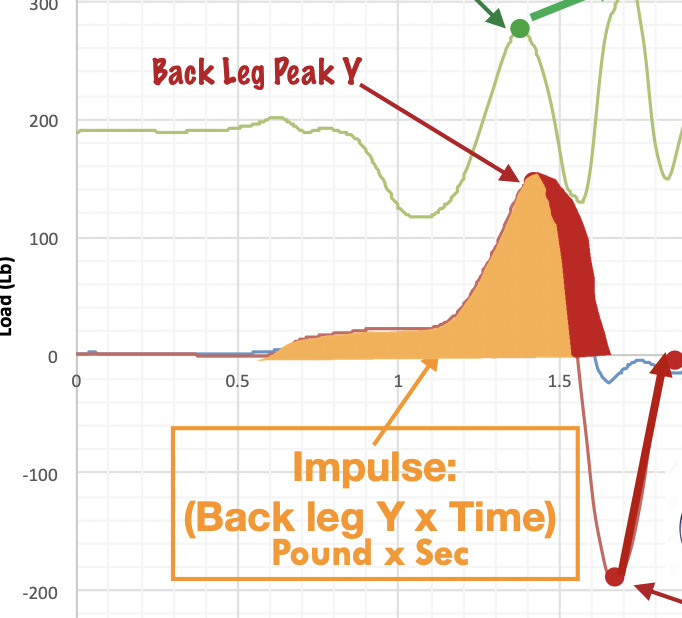
The green line represents Z force, which is the force directly into the ground. The red line is the Y axis. Force directed behind the pitcher is considered “positive” Y and negative Y is toward home plate. X force, or side to side movement is expressed in the blue line. Positive X is to the right and negative X is to the left. The initial upward curve of the green and red lines are indicative of back leg forces. When the red line dips below the zero line the athlete’s weight has been transferred to his front leg. When the and red line and green line peak for the second time, the front leg has reached full weight-bearing.
With the data normalized for the weight of our subjects, the XG Boost algorithm revealed the four most important data point for predicting velocity were:
- Impulse
- Lead Leg Peak Y
- Time of Transfer Peak Z to Peak Z
- Lead Leg Negative Y Return to Zero
1) Impulse the (orange shaded area) is technically the integral of the Y curve from zero, when the athlete starts moving down the mound to when it crosses zero and heads negative and force is transferred to the lead. Impulse is calculated by multiplying the amount of force the athlete produces toward second base by the amount of time he pushes before crossing the zero line. For example, if the athlete pushes backward at 100 pounds and holds that load for 0.5 seconds, his impulse would be 50.
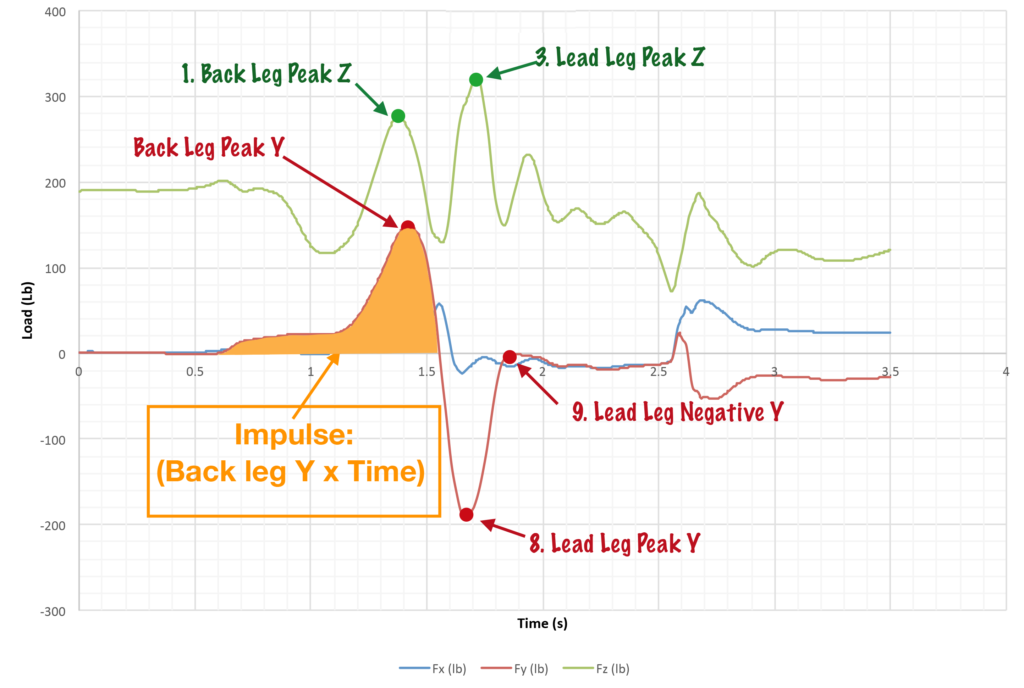
2) Lead leg Peak Y is self-explanatory and represents the amount of force the lead leg is applying toward the plate.
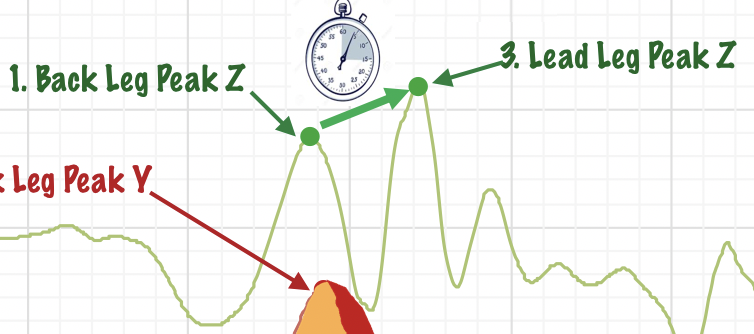
3) Time of Transfer peak Z to Peak Z is a timing metric that describes the rate at which the back leg Z force is transferred to the front leg Z.

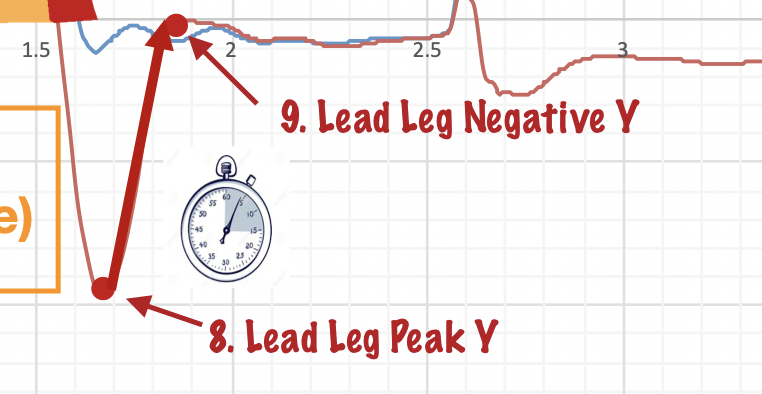
4) Lead leg “Negative Y Return to Zero” is the time from Lead Leg Peak Y to the return to the zero line. Some refer to this as the “clawing” or “blocking” action of the lead leg. We call it swing leg retraction and Return from Negative Y.

Now let’s dig into each of the four contributing variables:
First, we note that in our most high-velocity pitchers the back leg Z curve and the back leg Y curve are usually relatively proportional. When this happens, we can assume the athlete is pushing down into the ground and backward with the same ratio of force. Symmetrical back leg Z and Y forces infer co-contraction of the muscles of the back hip.
A key to improving velocity is to expand the area below the impulse curve. There are two possible options for increasing impulse.
You can push hard off of the rubber. In doing so, you might cause the Y curve to spike upward, but there is a limit to how high you can get it to go. Also, a disconnected/forced forward move can be an impulse robber.

A better way to expand the impulse and thereby improve velocity is to ride a co-contracted back hip, holding a hinged load of the gluteus medius and gluteus minimus (the little glutes).
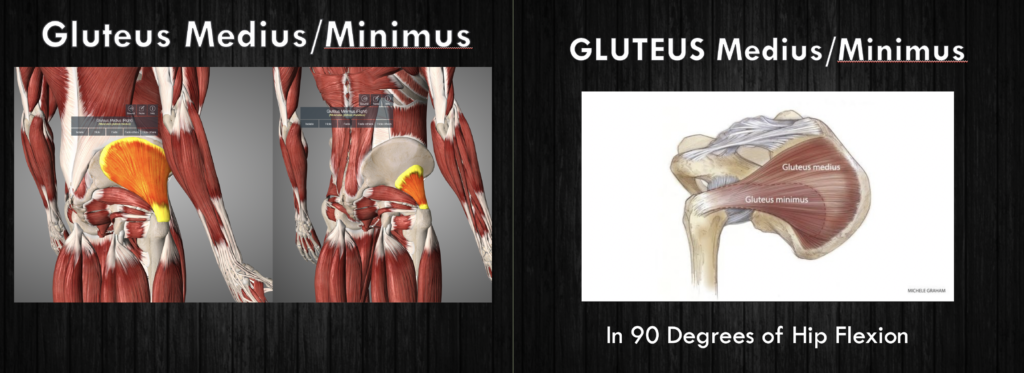
When the leg is non-weight bearing, and the hip is in neutral, the gluteus medius and minimus serve as abductors of the hip. The picture on the right shows the pelvis tilted anteriorly 90 degrees. When the hip is hinged to around 45 to 55 degrees, the fibers of the little glutes are oriented to abduct and externally rotate the hip.
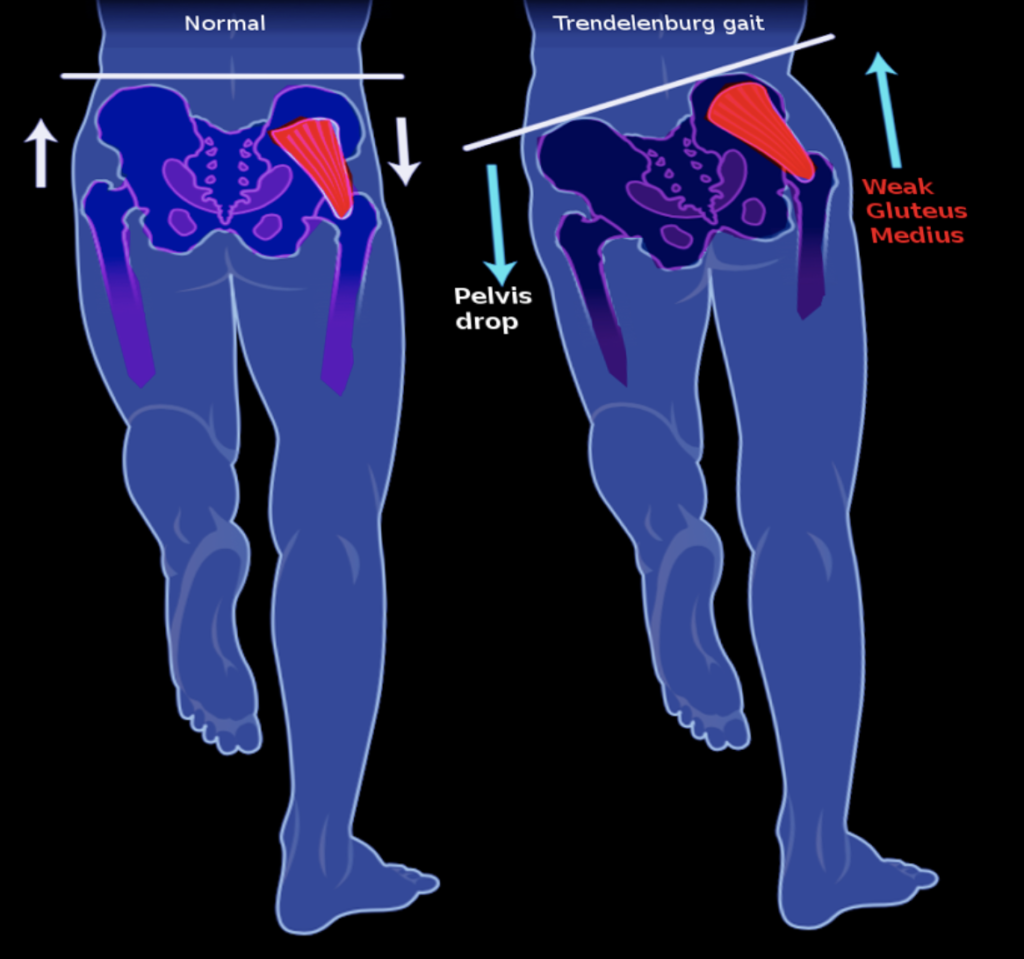
When the hips are hinged, the back leg is in a weight-bearing position, and the lead leg is lifted, the little glutes are vital for holding the lead leg side of the pelvis above the back leg side. In physical therapy, it is widely understood that weakness in the gluteus medius and minimus makes it difficult to stabilize the pelvis during the gait cycle. When the opposite leg is lifted, a weak gluteus medius allows the pelvis to drop. In my early years as a PT, the most common surgical technique for total hip replacement was known as the “posterolateral approach.” During a posterolateral hip replacement, the gluteus medius was detached at its insertion on the femur by carving out a small flake of bone at its attachment point. The gluteus medius was laid to the side and the procedure was completed. After the hip was replaced, the surgeon put the little glutes back into their normal position and allowed it to heal over the next six weeks like a fracture. Because the patient was unable to bear weight on the involved leg during that six weeks, the little glutes became weak and atrophied. Until these muscles were strong enough to support the pelvis and prevent contralateral hip dropping, the patient tended to walk with a distinctive, limp known as a Trendelenberg Gait. At full weight bearing on the involved limb, the patient would lurch his trunk to the side to compensate for the dropping of the pelvis on the non-surgical side.
Keeping the little glutes at optimal length and the back hip muscles co-contracted holds the pelvic tilt and expands the amount of time the athlete can create a positive Y force. Delaying the leveling of the pelvis expands the impulse and sets in motion a sequence of mechanical efficiencies that all contribute to velocity.
Another essential influencer of velocity is the time of Z to Z transfer.
Z-to Z transfers represents the speed of transfer from the back leg to the front leg. Delaying the leveling of the pelvis by co-contraction of the back leg little glutes and other muscles around the hip allows a rubber band-like stretch in the lower abdominals that, when suddenly released, catapult the body, the arm, and the ball forward. If the pelvis remains in a neutral position, or if the leading side is lowered too soon, the speed of Z to Z transfer is significantly dampened.
Peak lead leg Y is the by-product of the efficiency and explosiveness of the back leg impulse and Z to Z transfer. Peak Y force is actually the result of the athlete pushing hard into the ground to decelerate the center of mass. In elite throwers, Y force is automatically initiated by two innate reflexes known as the “crossed extension reflex” and the “stumble” reflex. There is no need to intentionally “block” the lead leg, and doing so may disrupt the synergy of the remainder of the delivery.
Finally, the rate of return to zero from peak negative Y shows the lead leg retracting and pulling backward to facilitate back hip rotation into late launch.
Many people have considered the relevance of this “clawing action,” but it is important note that intentionally “blocking” the lead leg can be corruptive as it can force the pelvis to tilt anteriorly, or to rotate excessively in the transverse plane, compromising lumbar and abdominal stability.
Consciously “Blocking” the lead leg is a movement efficiency killer.
Interestingly, of all the possible velocity contributors we studied, the least important was stride length. For years, some “experts” in baseball training world have insisted on reductionist concepts like, “the stride should be 120% of the height of the body” and “mass = gas!”
The length of the stride is a product of the duration of the ride. And that duration or distance is different for every person.
According to the data from our force sensor studies, mass is important for velocity up to about 180 lbs.
After that, the body organizes itself and it really doesn’t matter how much you weigh. For example, weight 210 pounds doesn’t make you more likely to throw harder than if you weigh 180 pounds.
Now, let’s get back to impulse.
Our XG-Boost machine learning algorithm suggests that expanding the area under the curve to the right of the current impulse metric is a highly recommended strategy power, synchronization for velocity enhancement. The impulse curve can be expanded by learning to hinge and co-contract the gluteus medius and gluteus minimus, thus keeping the pelvis elevated momentarily. This delay allows the athlete to take advantage of the elastic and mechanical properties of the back hip musculature. Expansion of impulse accelerates the time of transfer of back leg Z to front leg Z force. It also increases the lead leg peak Y force as the athlete braces against the ground with the landing leg and, finally, it enhances the return to on the lead leg. In essence, the pitcher’s impulse is the first domino that sets an entire downstream process in motion.
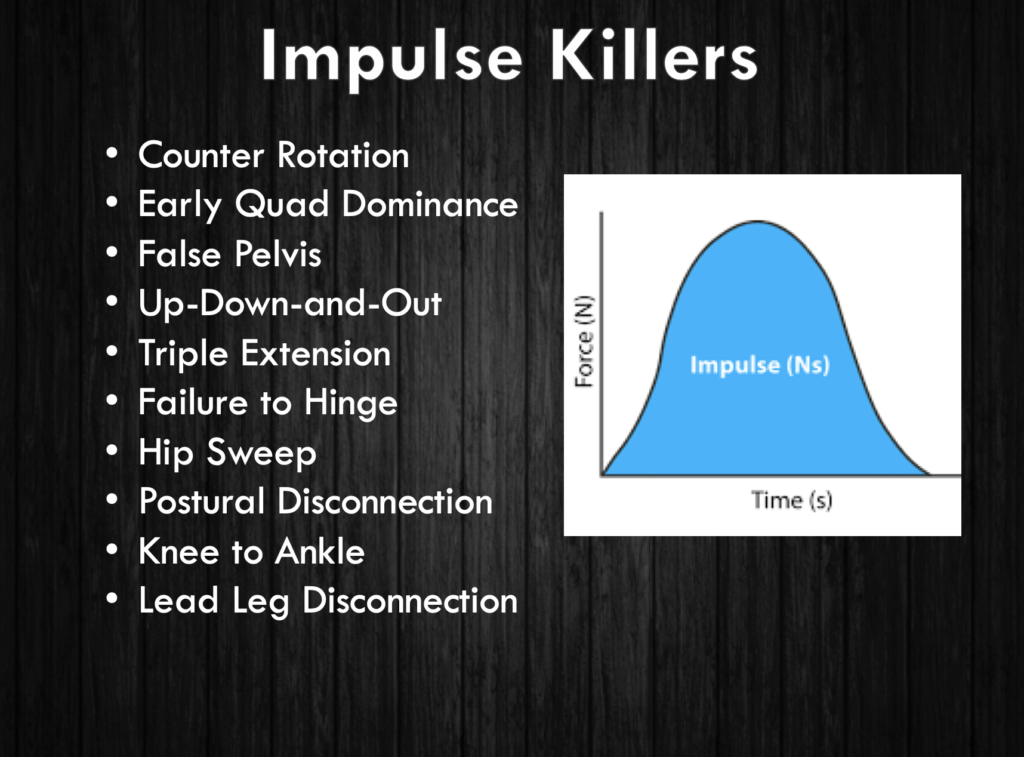
As it turns out, nearly all of the the lower-half efficiencies the ARMory process has considered to be disconnections are impulse killers. Either through reciprocal inhibition, or by removing the little glutes from optimal length, these movement patterns disable or suppress the little glutes activity and thus become significant impulse and velocity killers.
If you’d like to join us for the most sophisticated and highly effective process in the baseball training industry, call our CFO/COO, Amy Marsh at 866-787-4533 or click on one of the buttons below to learn more about how to engage our services.
We’ll see you at The ARMory.
For more information on the revolutionary Newtforce mounds and hitting pads, contact Kyle Barker by emailing him at KBarker@aeronautique.us or call him at 501-749-9116

Randy Sullivan, MPT, CSCS CEO, Florida Baseball ARMory